Mauna_Loa_weekly.pdf https://climateauditor.com/wp-content/uploads/2026/01/mauna_loa_weekly.pdf
Data Analysis:
Figure 1 shows the atmospheric CO2 concentration measured weekly at the Mauna Loa Observatory (see Ref.1) for the period 29 March 1958 to 29 November 2025.
. The Observatory is at Latitude 19.54° North, Longitude 155.57° West, Elevation 3397 metres. It is on the northern slope of Mauna Loa, an active volcano on the island of Hawai’i in the mid-North Pacific Ocean.
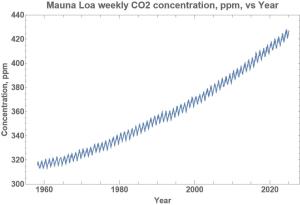
Figure 1. Mauna Loa weekly CO2 concentration.
As there were missing values in the time sequence, interpolation was applied using a fourth order polynomial fit to adjoining data strings and a weekly time interval of 7.0 days, for the following analysis of the CO2 concentration time series. The original time series consisted of 3457 values while the interpolated time series consisted of 3532 values at a uniform weekly interval.
The series shows a regular seasonal variation superimposed on an upward trend. The linear trend for the whole period of 67 years was 1.65 ppm per annum. For the 5 year period 29 March, 1958 to 23 March 1963, the rate was 0.72 ppm pa. For the 5 year period 05 December 2020 to 29 November 2025, the rate had steadily increased to 2.62 ppm pa, more than 3.66 times greater than 62 years earlier. The acceleration in the rate of generation of CO2 over the time of the measurements is attributed to an increase in the source of CO2 relative to the sinks in response to the gradual increase in temperature since the end of the Little Ice Age. Justification for this claim is that the increase in the Sun’s temperature has been greatest in the Equatorial zone and minor at the Poles.As the solubility of CO2 decreases with increasing temperature more CO2 effervesces from the large area of Equatorial ocean with little change in the absorption of CO2 over the small area of the Poles. In the Equatorial zone the Sun is vertically overhead twice per year while in the Polar regions the Sun is at a shallow angle to the surface for half of a year and absent for the other half.
There are three inflections in the graph corresponding to the time of the volcanic eruptions at Mount Agung, Bali, Indonesia, 17 March and 16 May, 1963, Mount Pinatubo, Philippines, 12 June 1991, and Kilaueu, Hawai`i, May 2018. A step in the CO2 concentration appears to have occurred due to the volcanic activity. The Mauna Loa Observatory is 9598 km on a bearing of 71̊East from Mount Agung, 8859 km on a bearing of 72̊East from Mount Pinatubo and 4226 km on bearing of 82̊West from Kilaueu. These events contrast with the lack of any change in the accelerating rate of increase of CO2 during the reduction of economic activity from the 2019 pandemic or the current ‘Net Zero’ effort negating the claim that CO2 has been increasing due to human activities.
The amplitude of the seasonal variation ranged from 5.72 ppm, 17 October 1970 to 15 May 1971, to 10.10 ppm, 12 September 2015 to 09 April 2016, changing from year to year in an irregular fashion but clearly increasing in amplitude over time. The maximum in the seasonal variation occurred during the early Summer months. As the seasonal variation in temperature and climate are driven by the change in the Sun’s irradiation as the Earth orbits the Sun annually, it is the seasonal temperature/climate change that causes the change in CO2 concentration not the reverse. CO2 concentration change does not cause the temperature or climate of the Earth to change as claimed by the UN IPCC.
The annual rate of change of the CO2 concentration was determined from the interpolated weekly time series by taking the difference between values 52.8211 weeks apart, being the average number of weeks in a year, and is shown in Figure 2. It displays the estimated annual rate of change of the CO2 concentration with high frequency noise superimposed on a cyclic pattern with a linear trend of 0.029 ppm pa per annum.
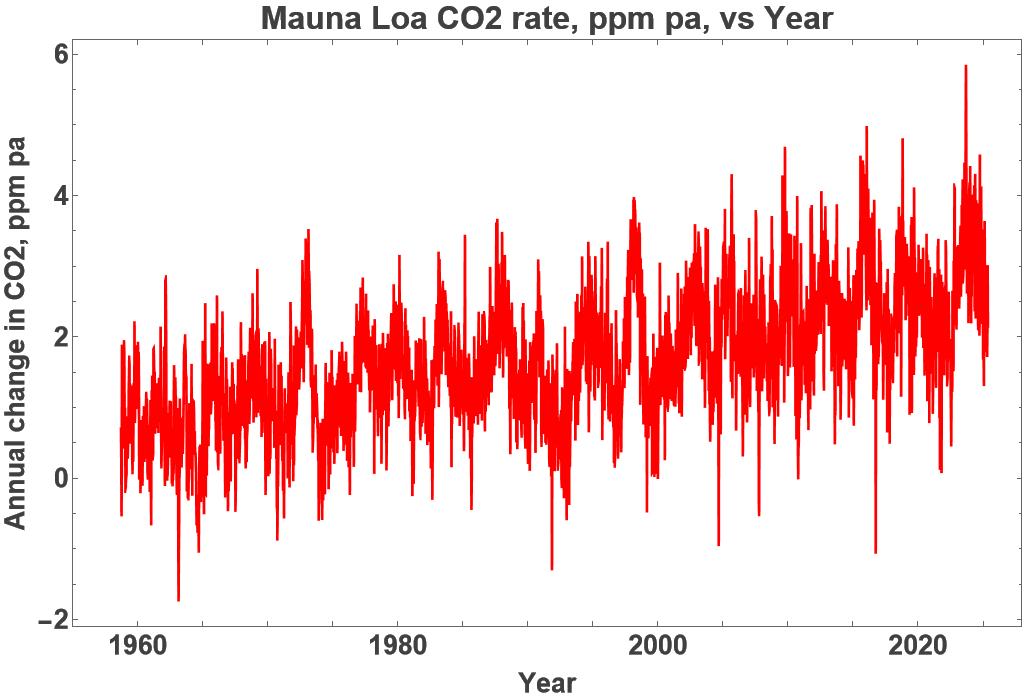
Figure 2. Mauna Loa annual rate of change of CO2 concentration.
The least annual rate of change of -1.68 ppm pa per annum occurred in the 12 monthperiod centred at 23 February 1963, possibly due to the major volcanic eruption of Mount Agung,Bali, Indonesia, 17 March and 16 May, 1963, and the greatest rate of change was 5.79 ppm pa perannum in the 12 month period centred at 09 September 2023. The linear rate of increase in Figure2 is 0.029 ppm pa throughout the 67 years of recording regardless of the efforts of mankind toreduce the atmospheric CO2 concentration.
The sequence of maxima and minima for the annual rate of change of CO2 concentration matches that for the Oceanic Niño 3.4 Index (Ref.2). In order to better illustrate the correlation between the two series, Figure 3 shows the detrended Mauna Loa annual rate of change of CO2 concentration, after smoothing with a low pass filter, overlain on the Oceanic Niño 3.4 Index, both covering the same 68 year period. In considering the relationship between the two series it is necessary to be aware that the Mauna Loa rate of change was derived from a weekly series of measurements taken at a single point on the globe. The Oceanic Niño 3.4 Index is the anomaly in the sea surface temperature relative to a 30 year average over the Equatorial zone between latitudes 5° South to 5° North and longitudes 120° West to 170° West, an area of the central Pacific Ocean of 6,568,670 square kilometres. The Mauna Loa Observatory is 2,450 km from the centre of the Ninõ 3.4 area, on a bearing of 27.5° East of North.

Figure 3. Overlay of the Oceanic Niño 3.4 Index and the Mauna Loa smoothed, detrended CO2 annual rate of change.
As has been demonstrated in earlier studies of CO2 data on the Climate Auditor web pages, their seasonal variation has been attributed to biological sources in response to the associated temperature change. Likewise the close correlation between the Mauna Loa CO2 rate of change and the Oceanic Niño 3.4 Index, as shown by the coincidence of the major maxima in Figure 3, is attributed to the decrease in the solubility of CO2 to the maxima in sea surface temperature bought about by the major, world-wide climate event depicted by the Niño 3.4 Index.
There is a marked negative correlation in the centre of the graph in the later part of 1991 following the major volcanic eruption of Mount Pinatubo in the Philippines on 12 June 1991 which significantly altered the relationship between the rate of change of CO2 and the Oceanic Niño 3.4 Index. The eruption caused the rate of change of CO2 to drop to a minimum as the sea surface temperatures reached a local maximum. The eruption may not have been reflected in the ONI 3.4 sea surface temperatures as Mount Pinatubo is 1675 km North of the Equator well outside the ONI 3.4 area.
Autocorrelation Function:
More detail of the source of variation in the CO2 annual rate of change is shown by its autocorrelation function illustrated in Figure 4. It reveals a clear cyclic pattern based on the El Niño event as shown in the accompanying table listing the correlation maxima, Table 1.
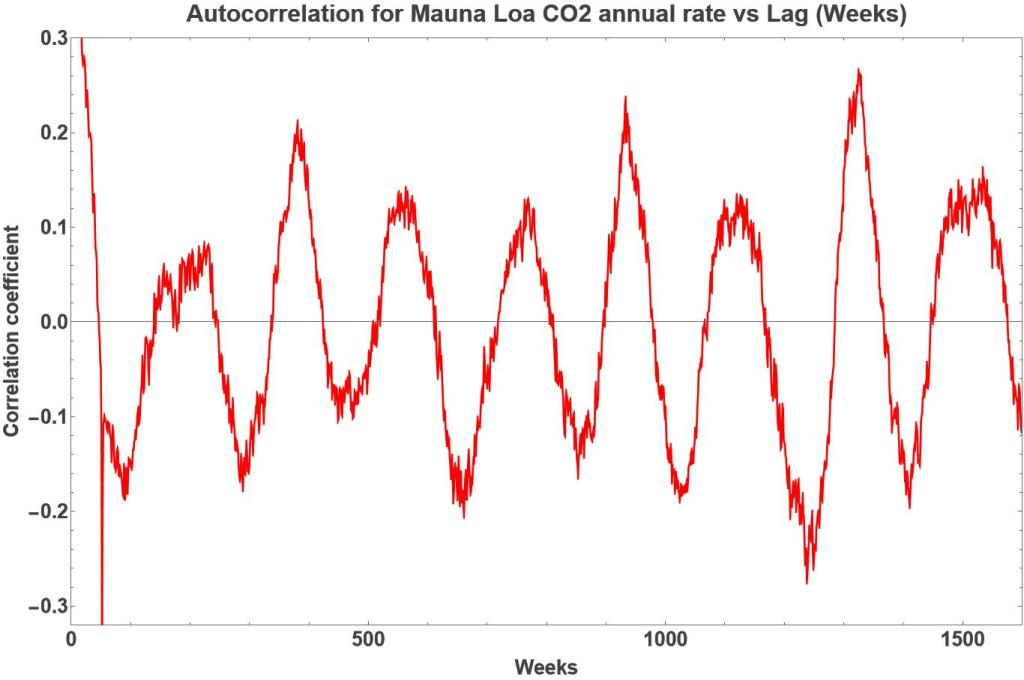
Figure 4. Autocorrelation for CO2 annual rate of change.
Table 1. Autocorrelation maxima
Amplitude Years Weeks Days Source
0.059 2.99 156.0 1092 pre-El Niño
0.081 4.43 231.0 1617 post-El Niño
0.211 7.30 381.0 2667 2 x El Niño
0.140 10.79 563.0 3941 3 x El Niño
0.130 14.74 769.0 5383 4 x El Niño
0.236 17.88 933.0 6531 5 x El Niño
0.133 21.46 1120.0 7840 6 x El Niño
0.265 25.39 1325.0 9275 7 x El Niño
0.161 29.40 1534.0 10738 8 x El Niño
The average from Table 1, column 4, adjusted for the multiple expressions of the El Niño event was 1328 days. The event clearly dominates the CO2 annual rate of change indicating that this major climate event determines the rate of generation of CO2 in the Equatorial region confirming the earlier proposition that the temperature level determines the rate of change of CO2 concentration as seen in the monthly data for Cape Grim and Macquarie Island stations and Mt Waliguan Observatory described in the analysis of data from each site and reported in the pages of: https://www.climateauditor.com .
Discrete Fourier Transform:
Figure 5 shows the amplitude spectrum from the Discrete Fourier Transform of the interpolated time series for the annual rate of change of the CO2 concentration series length of 3479 values. The amplitude scale was clipped to better display the higher frequency, shorter wavelength events so it excludes the maximum of 8.48 at x-coordinate 18, equivalent to a period of 1353 days, which dominated the autocorrelation function. This confirms the maximum predicted to represent the response to the El Niño event already seen in the autocorrelation function.
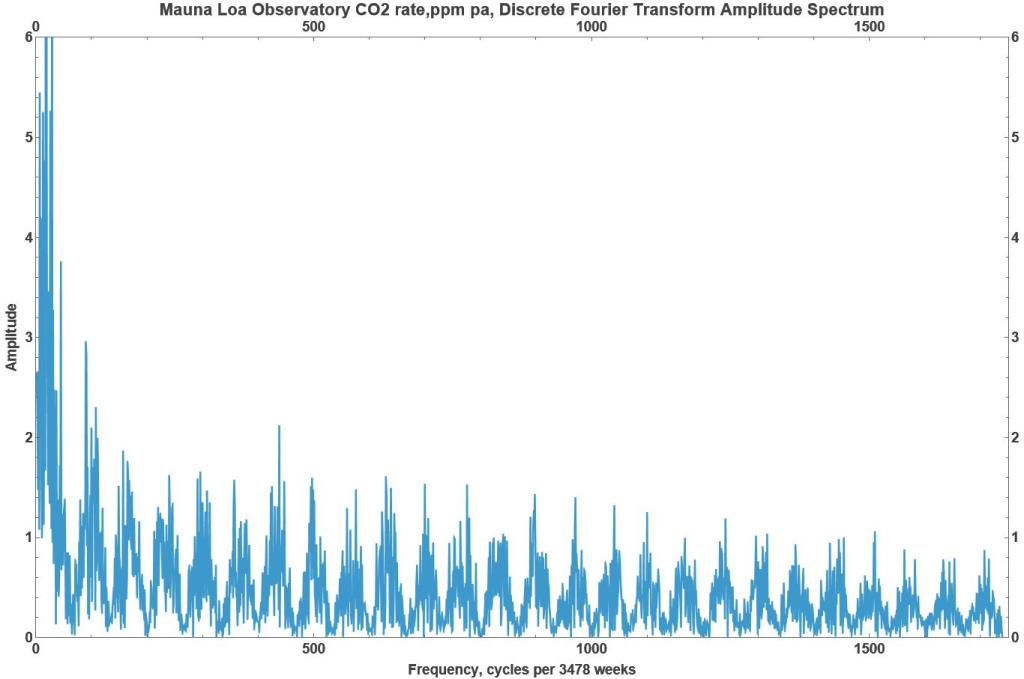
Figure 5. DFT Amplitude spectrum of the annual rate of change of CO2 concentration.
There is a multitude of local maxima in the Amplitude spectrum some of which have been assigned possible sources from the known periods of the Moon and planets between instances of the Sun, Earth, Moon or planets being in alignment. Average values for these periods have been taken from the publicly available literature. The periods drift due to the ever changing configuration of the Solar System and this may contribute to a broadening of the spectral responses. There are other periodic events, such as changes in the ellipticity of the orbits which have not been taken into account in this study.
A list of possible sources is shown in Table 2 for a selection of the peaks in the DFT amplitude spectrum. They are listed by the coordinate on the x axis, in cycles per 3478 weeks, and the amplitude of response with period in years and days for ease of reference to orbital periods of the Moon and planets.
Edit update to here Friday 30 January
Table 2
x-coord Amplitude years days possible source
7 4.87 9.22 3368.0
18 10.82 3.59 1309.8 El Nino
28 5.77 2.31 842.0 Mars synodic
44 3.60 1.47 535.8 18 x Moon draconic
87 3.08 0.74 271.0 10 x Moon draconic
105 2.14 0.61 224.5 2 x Mercury synodic
162 1.96 0.40 145.5 5 x Moon synodic
233 1.45 0.28 101.2
287 1.78 0.22 82.1 3 x Moon draconic
346 1.44 0.19 68.1
424 2.29 0.15 55.6 2 x Moon draconic
478 1.55 0.14 49.3
558 1.33 0.12 42.3
678 1.50 0.10 34.8
755 1.68 0.09 31.2 Moon synodic
821 1.10 0.08 28.7
868 1.76 0.07 27.2 Moon draconic
940 1.60 0.07 25.1 daily temperature cycle
1008 1.54 0.06 23.4 daily temperature cycle
1065 1.36 0.06 22.1 daily temperature cycle
1131 1.04 0.06 20.8 daily temperature cycle
1202 1.01 0.05 19.6 daily temperature cycle
1270 1.29 0.05 18.6 daily temperature cycle
1324 1.21 0.05 17.8 daily temperature cycle
1399 1.32 0.05 16.9 daily temperature cycle
1462 1.18 0.04 16.1 daily temperature cycle
1514 1.07 0.04 15.6 daily temperature cycle
1579 1.06 0.04 14.9 daily temperature cycle
1653 1.04 0.04 14.3 daily temperature cycle
Some of these may also relate to the periodicities resulting from the Short-term orbital forcing described in Cionco, R. G., and Soon,W. W.-H.[ Ref. 3 ].
Conclusion:
The major influence on the rate of generation of atmospheric CO2 in the Equatorial zone has been the El Niño event, that is, climate change causing a change in the rate of generation of CO2, the complete opposite to the UN IPCC claim that CO2 causes climate change. As far as is known, no physical process has been proposed whereby the CO2 change could cause an El Niño event.
Furthermore it is notable that both the synodic and draconic periods of the Moon are apparent throughout the 65 year weekly series. An explanation for the synodic period is that each New Moon reduces the incoming Sun’s radiation to the Earth and its atmosphere as it passes between the Sun and the Earth. Similar temperature minima must occur when Mercury and/or Venus pass between the Sun and the Earth.
The draconic period is due to the Moon’s elliptical plane being at an angle of 5.14° to the Earth’s elliptic relative to the Sun. As a result, when the Moon passes through one of the two nodal points, where the Moon’s ellipse intersects the Earth’s elliptic, it has the greatest influence in diminishing the irradiation of the Earth which, in turn, reduces the Earth’s surface temperature thereby causing a response in the rate of generation of CO2.
Except during a Solar eclipse when the drop in temperature is marked, the passing of the Moon through its nodal points may only causes a minor drop in temperature. In spite of this, there is a measurable effect on the rate of change of CO2 concentration apparent in the amplitude spectrum implying a significant sensitivity between temperature and CO2 rate of change. This action appears to have been completely overlooked by the UN IPCC in their assessment of the forces generating the Earth’s climate.
As a number of the spectral maxima approximately correspond with the synodic periods of the Moon and the planets, the results are interpreted as showing that the Sun’s irradiance of the Earth is modulated by the movement of the Moon and planets. This must cause corresponding changes in the Earth’s sea-surface and atmospheric temperatures which, in turn, cause changes in the CO2 concentration. This is contrary to the never-proven claim by the UN IPCC that increased CO2 concentration causes an increase in the Earth’s atmospheric and surface temperature.
The IPCC First Assessment Report, 1990, consists of this IPCC Overview, quote:
This Overview reflects the conclusions of the reports of (i) the three IPCC Working Groups on science, impacts, and response strategies, and (ii) the Policymaker Summaries of the IPCC Working Groups and the IPCC Special Committee on the Participation of Developing Countries.
1. Science
This section is structured similarly to the Policymaker Summary of Working Group I.
1.0.1 We are certain of the following:
•There is a natural greenhouse effect which already keeps the Earth warmer than it would otherwise be.
•Emissions resulting from human activities are substantially increasing the atmospheric concentrations of the greenhouse gases: carbon dioxide, methane, chloro-fluorocarbons (CFCs) and nitrous oxide. These increases will enhance the greenhouse effect, resulting on average in an additional warming of the Earth’s surface. The main greenhouse gas, water vapour, will increase in response to global warming and further enhance it.
End quote.
Both of the above claims appear to have no scientific basis. The first claim is shown to be untenable in the opening page of this web site, entitled “Greenhouse Effect”. The second claim is also untenable as no one could know, to this day, all of the possible sources and sinks for the Earth’s atmospheric CO2. To claim that “Emissions resulting from human activities are substantially increasing the atmospheric concentrations …” is at odds with the most recent measurements from the Mauna Loa Observatory. In 2020 during a World-wide pandemic with reduced human activity, the concentration was on average 2.55 ppm greater than for 2019.
References:
1. https://scrippsco2.ucsd.edu/data/atmospheric_co2/mlo.html
File: weekly_in_situ_co2_mlo.csv for the period 29 March 1958 to 14 October 2023.
2. Oceanic Nino Index, National Oceanic and Atmospheric Administration.
https://www.cpc.ncep.noaa.gov/products/analysis_monitoring/ensostuff/detrend.nino34.ascii.txt
3. Cionco and Soon, Short-term orbital forcing: A quasi-review and a reappraisal of realistic boundary conditions for climate modeling, Earth-Science Reviews 166 (2017) 206-222, Elsevier B.V.

Keep on writing, great job!
LikeLike
I’m extremely impressed along with your writing abilities as neatly as with the format
to your weblog. Is this a paid subject or did you modify it your self?
Anyway keep up the nice high quality writing, it’s uncommon to peer a great blog
like this one nowadays..
LikeLike
Excellent post. I was checking constantly
this blog and I am impressed! Extremely helpful information particularly the last part :
) I care for such information a lot. I was looking for this certain info for a very long time.
Thank you and best of luck.
LikeLike
Good post. I absolutely appreciate this site.
Continue the good work!
LikeLike