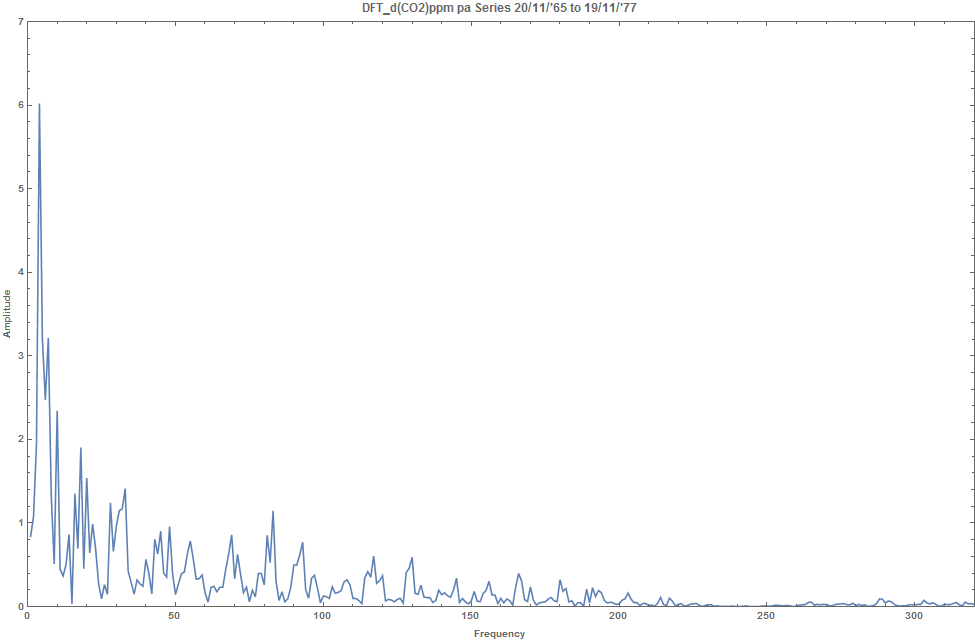
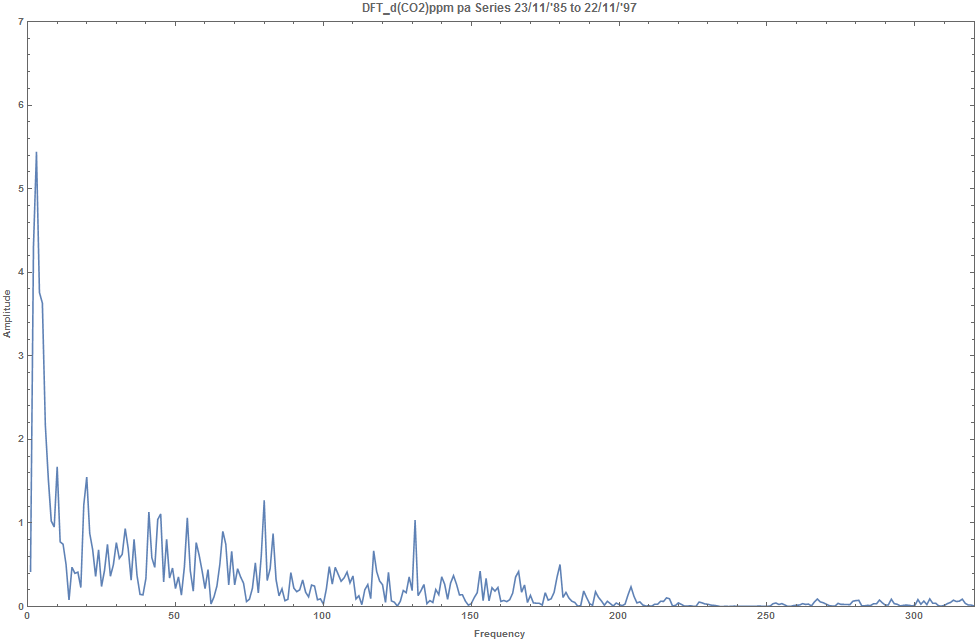
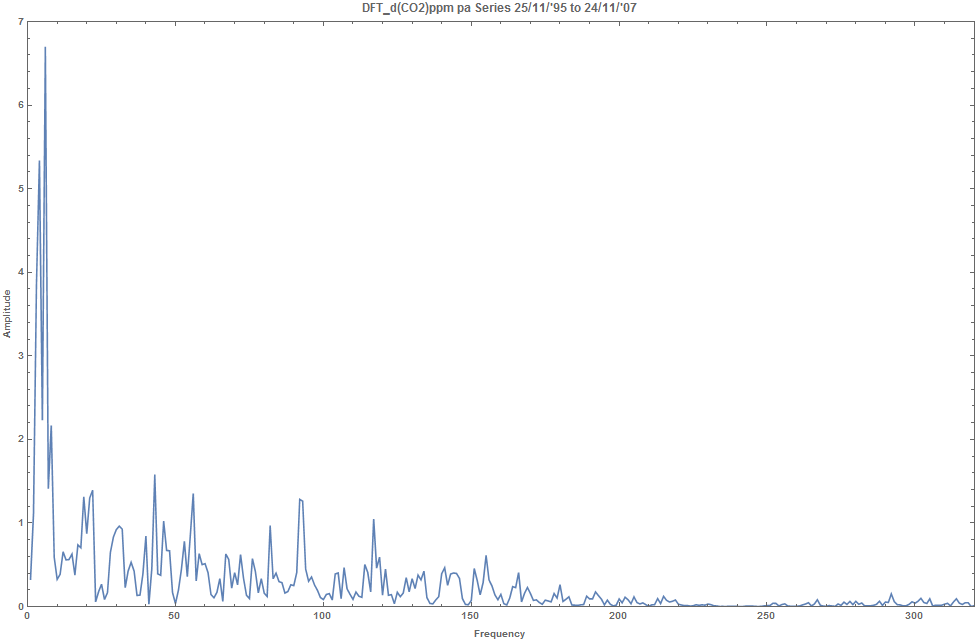
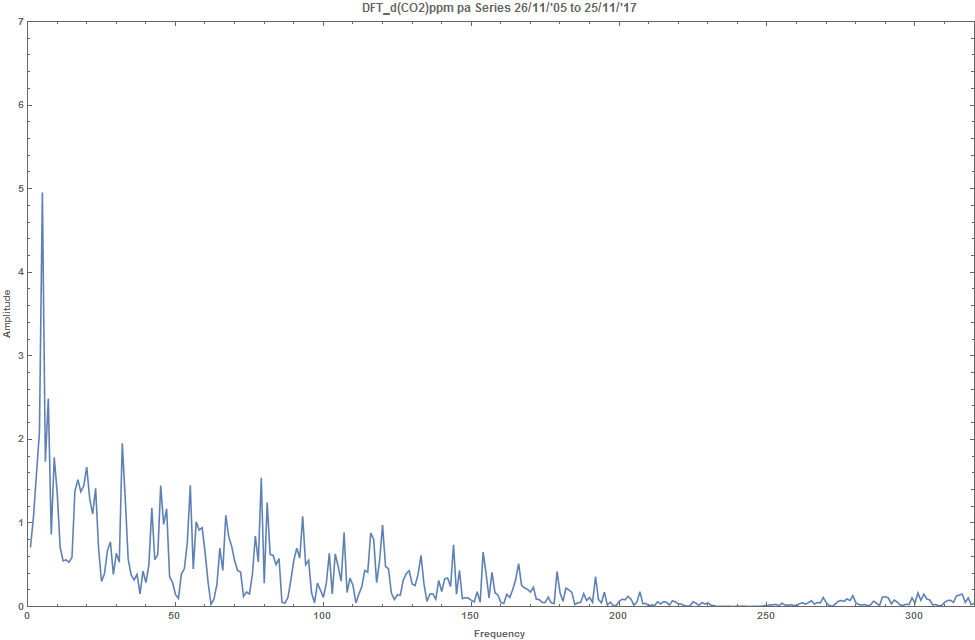
Here is the amplitude spectra for overlapping 12 year long, weekly data series from the Mauna Loa Observatory transformed to time series of 52 week increments of the CO2 concentration. They illustrate changes in the spectra with the progression of time. This is attributed to the ever changing configuration of the Solar system.


The weekly CO2 atmospheric concentration data measured at the Mauna Loa Observatory extends from 29 March 1958 to 28 April 2018. Polynomial fit to adjoining data strings was used to calculate missing values in the time series. A simple, three point low-pass filter was then applied using the weights (0.2929, 0.4142, 0.2929), after which the 52 week incremental values were determined. This time series was divided into five overlapping 12 year long series. An half Hamming filter was applied to the first and last 52 values of each series to minimise end effects, the series was padded with zero values at each end and the Fourier amplitude spectrum was calculated for each of the residual 640 long data strings after removal of their linear trend.
The resulting spectra are shown in the above graphs with the x-axis being 640 times the frequency in cycles per week and the y-axis being the Fourier amplitude.
The Fourier spectrum of the complete 60 year long time series of the 52 week increments described earlier, produced a prominent maximum at 1303 days (3.57 years). On the above spectra the maximum was at a period of 1493 days, 1120 days, 2240 days, 1493 days and 1120 days respectively, that is, a mean period of 1493 days (x-coordinate 3 on the above graphs). This has been designated earlier as the source of the heat driving the El Niño event.
Another series of maxima are present at 498 days, 560 days, 498 days, 640 days and 560 days respectively for a mean of 551 days, that is, shortly beyond x-coordinate 8. This is attributed to the synodic period of Venus of 584 days whereby the radiation received by the Earth is diminished as Venus passes between the Sun and the Earth.
The Earth’s orbital period of 365 days is partially represented with minor maxima at 345 days (coordinate 13), 373 days (coordinate 12), not evident, 407 days (coordinate 11) and not evident respectively. The amplitude is predicted to represent the range from perigee to apogee in the Earth’s orbit causing a corresponding change in the intensity of radiation received from the Sun.
The sidereal period of Venus of 224.7 days is predicted to be the source of the maxima at 235.8 days (x-coordinate 19), 235.8 days, 235.8 days, 213.3 days and 235.8 days respectively.
The synodic period of Mercury of 115.9 days is predicted to be the cause of the maxima at 115 days (x-coordinate 39), 115 days, 112 days,115 days and 109 days respectively. As with Venus, the response is attributed to the fall in radiation received by the Earth as Mercury passes between the Sun and the Earth.
The Moon is predicted to be the cause of lesser amplitude maxima at about coordinates 154 and 165 due do its draconic period of 27.1 days and synodic period of 29.5 days. The respective maxima were at 27.2 days (x: 165), 26.8 days, 27.2 days, 27.2 days and 27.2 days for the draconic period and 28.9 days (x: 155), 28.7 days, 29.5 days, 29.1 days and 29.3 days for the synodic period.
The source of other maxima remain to be identified. However as the maxima repeat across the five consecutive 12 year data samples, they clearly relate to physical events that effect the atmospheric temperature, via the proxy of the rate of change of CO2 concentration, and thereby determine the Earth’s climate.
Everyone loves it when people come together and share opinions.
Great blog, continue the good work!
LikeLike
The idea that Venus transiting between the Sun and Earth could cause a noticeable decrease in solar radiation arriving at the top of Earth’s atmosphere is interesting and can be checked with a simple calculation. The average observational diameter of the Sun is about 1900 arc sec and the maximal observational diameter of Venus (i.e. during a passage) is 66 arc sec. This means that Venus blocks about 0.12% of the Sun’s radiation during such a transit event, which lasts about 6-7 hours.
So the idea is pretty preposterous.
but wait, there is more. A transit does not happen every 584 days as implied in your post. The last such transit was in 2012 and is the last one in this century.
LikeLike
Dear climateauditor.com webmaster, You always provide great examples and real-world applications.
LikeLike
Hi climateauditor.com owner, Your posts are always a great source of knowledge.
LikeLike