The satellite lower troposphere temperature data available from the University of Alabama, Huntsville, Ref.1, provides seasonally adjusted, monthly temperature values for eight Latitude zones, namely Global: 90°S to 90°N, Northern Hemisphere: 0° to 90°N, Southern Hemisphere: 0° to 90°S, Tropics: 20°S to 20°N, Northern Extension: 20°N to 90°N, Southern Extension: 90°S to 20°S, North Pole: 60°N to 90°N and South Pole: 90°S to 60°S. This study is about the Global, whole of Earth temperature, over the 42 year period December 1978 to April 2021, shown in Figure 1.
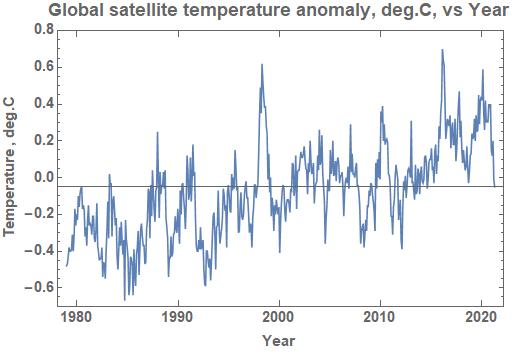
Figure 1.
Linear regression applied to the Global residual temperature time series gave the significant rate of change of 0.14 degrees Celsius per decade, being 21 times the standard error.
The monthly Global temperature is calculated by taking the mean value of a world-wide grid of values that are, in turn, the mean of the temperatures measured throughout the month at each of the individual grid points. The statistical Central Limit theorem rules that the mean of a set of mean values should approach a Normal Statistical distribution as the number of values increases. Treating the 509 Global temperature values as a set of samples gave an estimate for the source population as a Normal Statistical distribution with a mean of -0.077 degrees Celsius and a standard deviation of 0.245, with a probability of 52%. Here the mean is not an actual global temperature as all of the values are supplied with a reference level removed, being the average value over the 30 year period 1991 to 2020.
Treating the values as a Time Series gave an estimated model fit of an ARMA(1,1), that is, a first order autoregression moving average model in which each subsequent value is partly dependent on the previous value. The lack of independence between consecutive values means that the more-usual statistical tests are not applicable.
Data for the CO2 concentration measured at the Mauna Loa Observatory, Ref.2, for the period December 1978 to January 2021 is shown in Figure 2. Note that the global temperature and the CO2 concentration are both supplied after adjustment has been made for the seasonal variation.
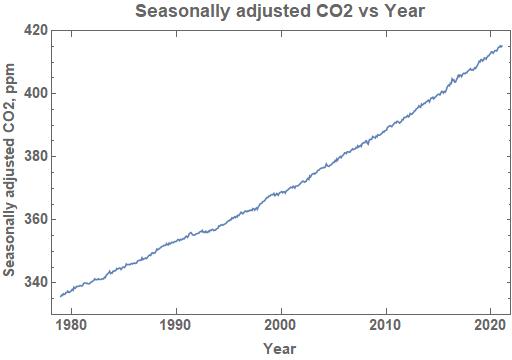
Figure 2.
Linear regression applied to the seasonally adjusted CO2 concentration gave the highly significant rate of change of 1.84 ppm pa, being 224 times the standard error.
Treating the 506 values of the seasonally adjusted CO2 concentration as a sample from a population gave an estimate for the source population of a Uniform Distribution (335.8, 415.2), that is a distribution that has the same probability for every sample value between the minimum and maximum values shown, (335.8 to 415.2).
Treating the values as a Time Series gave an estimated model fit of an ARIMA(1,1,1), that is, a first order autoregressive integrated first order moving average model in which each subsequent value is partly dependent on the previous value.
Visually the Global satellite temperature anomaly and CO2 concentration have completely different profiles. Treating the data statistically shows that the two sets of measurements fit different probability distributions and different Time series models indicating that there is no causal relationship between the two. While a positive linear trend can be calculated for each of the two series, this does not mean that there is any causal interrelationship as most time series will fit either a positive or a negative trend but this is not sufficient to prove that they are related in any way.
Temperature vs. CO2 rate of change
Figure 3 shows the annual rate of change of the CO2 concentration determined by taking differences between measurements 12 months apart. It replicates all of the major features of the Global temperature profile seen in Figure 1.
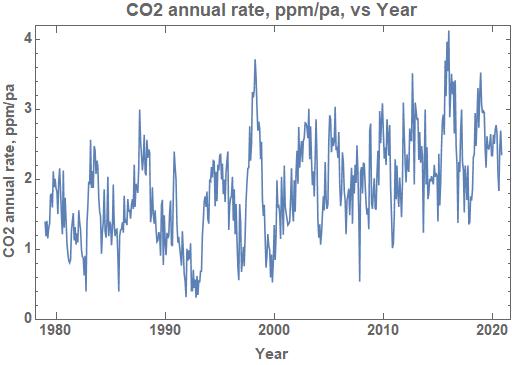
Figure 3.
Treating the calculated annual rates of change of CO2 concentration as samples from a population of such rates gave a 85% probability that the data arose from a Normal Statistical distribution with mean 1.86 ppm pa and standard deviation 0.72.
Alternatively, treating the calculated annual rates of change of CO2 concentration as a Time Series gave a fit of a third order autoregressive model AR(3), that is, a weakly stationary series in which each value is dependent on the previous three values of the time series with regression coefficients 0.5703,0.1628 and 0.1387 respectively.
The close appearance of the temperature and rate of change of CO2 graphs plus the fact that both series approximate to samples drawn from a Normal Probability distribution indicate that the temperature determines the rate of change of CO2 concentration. This is confirmed by the application of a first order autoregression model to the detrended global temperature as the independent variable and the annual rate of change of CO2 concentration as the dependent variable. It gave a Durban-Watson D value of 0.76 indicating a positive regression coefficient which was estimated to be 0.62. Adjusting the values for this coefficient gave a Pearson correlation coefficient of 0.13 with a probability of 0.3% that the correlation was zero.
Cumulative temperature vs. CO2 concentration
If the temperature determines the rate of generation of CO2, that is d/dt CO2 equals a constant multiplied by the temperature level then, mathematically, this implies that the CO2 concentration at a given time is proportional to the integral of the temperature up to that time relative to a base value at which no CO2 is generated. This would be the temperature at which there is a balance between the various sources and sinks of CO2 at the Earth’s surface. Note that the reverse is not possible as a time rate of change cannot determine a level. For example a rate of change of 2 ppm of CO2 could be from 1 to 3 ppm or 734 to 736 ppm or any other pair of values differing by two, all completely different situations.
Figure 4 shows the sum with respect to time of the global temperature values relative to a base of -0.67, the minimum value from the global list as a calibrated base is not known. The resulting near linear trend closely matches that of Figure 2, the Mauna Loa Observatory CO2 levels.
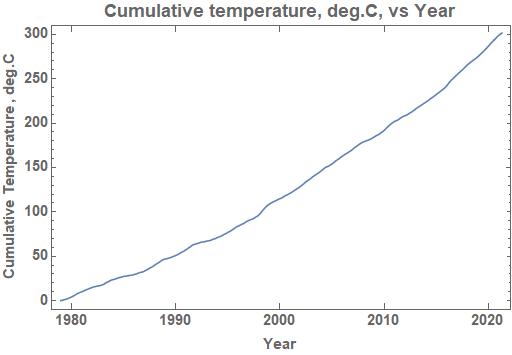
Figure 4.
Treating the 509 values of the cumulative temperature as a sample from a population gave an estimate for the source population of as a Mixture Distribution being mainly a Uniform Distribution combined with a minor part being a Normal Distribution.
Treating the values as a Time Series gave an estimated model fit of an ARIMA(1,1,1), that is, a first order autoregressive integrated first order moving average model in which each subsequent value is partly dependent of the previous value. That is, the same type of time series model as for the seasonally adjusted CO2 concentration but with different parameters due to the different measured physical properties.
Applying the Spearman Rank test, as the distributions are not Normal Distributions, gave a 98% probability that the correlation between the seasonally adjusted CO2 concentration and the cumulative temperature was practically 1.0.
Conclusion
Comparison between the seasonally adjusted monthly values for the global temperature and the CO2 concentration indicated that they were unrelated sequences. Comparison between the global temperatures and the annual rate of change of the CO2 concentration gave a definite indication that the temperature was a determining factor in the rate of generation of CO2. This was confirmed by the highly significant correlation between the cumulative temperature and the CO2 concentration as expected when the temperature determines the rate of generation of CO2.
This is supported by the conclusion on the accompanying web page:
Mauna-Loa-weekly-CO2-concentration-data
It found that the Fourier Amplitude spectrum of the annual rate of change of CO2 concentration derived from the weekly data for the Mauna Loa Observatory gave maxima at 27.17 days and 29.42 days. These are the draconic and synodic periods of the Moon which result in a drop in temperature each time the Moon passes between the Sun and the Earth.
Thus the commonly accepted hypothesis proposed by the UN IPCC that increasing CO2 concentration has caused global warming is invalid. The reverse, being temperature driving CO2 concentration, is what has actually happened over the 42 years of measurement. It has long been known that historic data has always shown that temperature change precedes CO2 change. This study provides the simple explanation for this event, namely, that the temperature level determines of rate of generation of CO2.

There is no University of Alabama in Houston, try Huntsville.
Are you using their current data, properly corrected for actual satellite position? For decades they used a guessed at position for the satellite that was incorrect.
LikeLike
Thank You Andy,
Obviously a lapse of memory on my part.
As for the satellite data, I use the latest listing from Dr Roy Spencer’s web site at the time of publishing each page.
LikeLike
I accept that the physics of this points to temperature having an effect on CO2 concentrations, but how do we reconcile this with climate alarmists telling us that it is the millions of cars and burning of fossil fuels that is generating CO2? I need to be able to address that question as the paper here seems to suggest there is none or little impact on CO2 from burning of fossil fuels. Can you help?
LikeLike
Not necessary as the CO2 has not and cannot warm the Earth via the re-circulation of that heat back on itself. An ordinary household thermos flask does not make its contents hotter. If it did we would not need an additional source of heat to raise the temperature of the contents.
LikeLike
Their hypothesis is that the sun is repeatedly adding heat each day and that CO2 is the insulator slowing heat loss. Thus if we add heat every day and reduce heat loss, the temperature of the thing (earth surface level atmosphere) will get warmer. The additional heat source you refer to is the sun each consecutive day.
My question was specifically about how best to answer the alarmists’ objection to the notion that CO2 levels follow global temperature dynamically.
LikeLike
The Earth’s atmosphere has always contained CO2. It is estimated to be 4.5 billion years old. The earliest geological era is named the Hadean era after Hades due to the extensive volcanic activity creating sheets of molten lava across the surface. Volcanic activity produces copious amounts of atmospheric CO2 so how could the temperature have fallen to the present-day comfortable level if the ever-present atmospheric CO2 warms the Earth?
In every minute of every hour, night or day, the atmospheric CO2 absorbs and re-radiates heat from the Sun and the Earth’s surface and has been doing so for more than 4 billion years. If this caused warming of the Earth’s surface then surely at least all of the oceans would have evaporated by now. It is simply ridiculous to claim that such warming is taking place and will cause catastrophic conditions in the near future. If true then it would have happened long ago, life on Earth would have ceased and we would not be here to listen to such illogical nonsense.
Like every inert, material entity, the atmospheric CO2 is merely a conduit for the passage of heat energy from hot bodies, the Earth’s surface, to colder bodies, outer space, via the atmosphere as part of the normal process towards achieving thermal equilibrium. It does not produce any heat so it cannot warm anything.
The fictitious warming claim promoted by the UN IPCC and the World Economic Forum is simply untenable. It is an attempt to instill fear into the population at large, cause an economic collapse and then claim that a ‘One World Government’ is necessary, run by them, of course.
LikeLike
Does the first law of thermodynamics apply, and if so, why has that not been made a feature discussion point amongst the elite driving so many of our geopolitical policies, and why have not the politicians appearing to dissuade climate alarm made a point of this.
LikeLike
Does the first law of thermodynamics apply, and if so, why has that not been made a feature discussion point amongst the elite driving so many of our geopolitical policies, and why have not the politicians appearing to dissuade climate alarm made a point of this.
LikeLike
Hello climateauditor.com administrator, Keep up the great work!
LikeLike
Thank you for your work. Maybe disagree with some parts like this, “Like every inert, material entity, the atmospheric CO2 is merely a conduit for the passage of heat energy from hot bodies, the Earth’s surface, to colder bodies, outer space, via the atmosphere as part of the normal process towards achieving thermal equilibrium. It does not produce any heat so it cannot warm anything.” CO2 isn’t exactly inert. It acts to lengthen a portion radiation emitted from the earth. This is insulative. A larger resister runs hotter, a coffee thermos with 2″ insulation hotter than with 1″.
Separately, you claim that radiation from the sun would have cooled the earth via the greenhouse mechanism. But it didn’t. Therefore greenhouse effect is not in effect. but you also sighted the calculation showing outbound photon density / inbound photon density = orders of magnitude. This leaves open the logical possibility that greenhouse could be in effect on the outbound path.
LikeLike
Thank you Matthew Rempe, perhaps you will find my latest analysis answers your concerns, see Mauna_Loa_weekly.pdf.
LikeLike